

October 2026 Market Action Report: Portland Metro and Yamhill, Polk and Marion Counties

The numbers are shifting big time, but stick around to the end for the silver lining!
September brought the expected fall shift: fewer closings, more market time, and a noticeable pullback in pending sales across both markets. And it is not just a local story. Nationally, existing-home sales came in at 3.99 million annualized in September, down 2.2% from a year ago, according to the National Association of Realtors. Inventory nationally has climbed to 4.8 months of supply, the highest since 2020. Realtor.com reported that 20.8% of active listings nationally took a price cut in September, the highest September rate since 2018. The national median list price has now fallen year-over-year for eleven consecutive months.
This is the context our local numbers are sitting inside. Portland Metro and Polk & Marion are not outliers, they are part of a broader national recalibration. Buyers have more options and more leverage than they have had in years. That is the honest read heading into Q4.
PORTLAND METRO

How September Stacked Up
Closed Sales: 1,752 ▼ 4.0% vs September 2025
Pending Sales: 1,760 ▼ 17.9% vs September 2025
New Listings: 2,487 ▼ 0.4% vs September 2025
Average Sale Price: $630,500 ▲ 2.2% vs September 2025
Median Sale Price: $545,000 — Flat vs September 2025
Inventory: 4.2 months ▲ 0.4 vs September 2025
Total Market Time: 68 days ▲ 6 days vs September 2025
YTD Closed Sales (Jan–Sep 2026): 15,649 ▲ 2.3% vs same period 2025
Pending sales down 17.9% is the number that jumps out, and it deserves a straight answer, not just context. Yes, September 2025 was an unusually active month for pending sales, which makes the comparison look worse than it is. But pending sales are also the leading indicator, they tell you what closings will look like in October and November. A 17.9% year-over-year drop is a meaningful signal that buyer demand has softened. That is not a reason to panic, but it is a reason to be realistic about what the fall pipeline looks like.
Total units closed year-to-date through September stand at 15,649, up 2.3% over 2025, which sounds encouraging. But for perspective: that number is still well below the 2021 peak, and the national trend of declining transaction volume is the backdrop here. Fewer homes are selling across the country, and Portland Metro is moving with that tide, not against it.
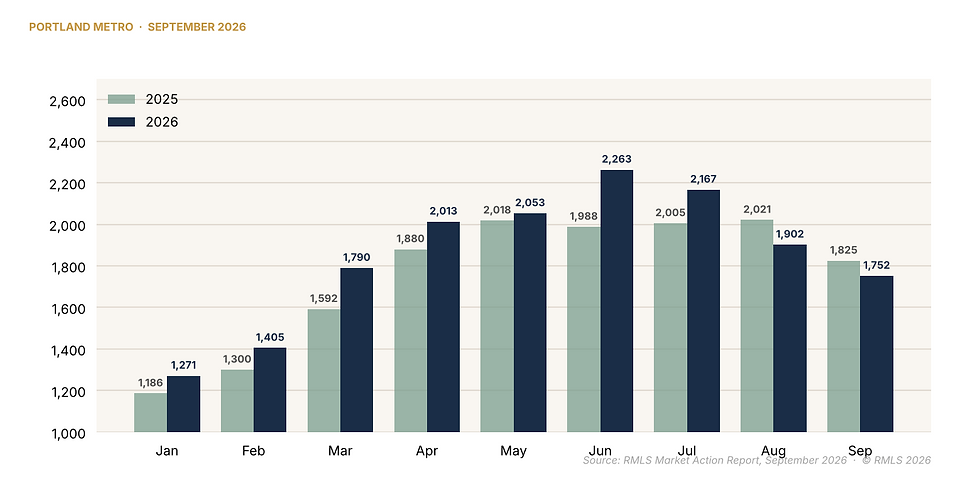
The rolling 12-month average sale price is up 0.4%, that is technically positive, but it is also essentially flat. Prices are holding, not climbing. In a market where 1 in 5 listings nationally is taking a price cut, "holding steady" is the real win. Do not confuse it with appreciation momentum.
Inventory reached 4.2 months in September, the highest point of 2026 for Portland Metro. For context, six months is the traditional threshold for a buyer's market. At 4.2 months, Portland Metro is in balanced-to-buyer territory, and the direction of travel matters: inventory has been rising steadily since spring. Buyers have the most options they have had all year, and sellers who have been waiting for a "spring surge" energy to return are likely to be disappointed. It has not materialized, nationally or locally.
Price band activity remained concentrated in the mid-range. The $400K–$500K band led with 362 closings (20.7%), followed by $500K–$600K at 312 (17.8%), and $600K–$700K at 246 (14.0%). The upper bands are still moving, 38 closings in the $1.1M–$1.2M range, but mid-range inventory is where the competition for buyers is most intense right now, and that is also where price sensitivity is highest.


A note on Yamhill County: 89 homes closed in September with an average sale price of $623,200 and an 88-day market time. The rolling 12-month average is up 2.2% year-over-year and the YTD median sits at $480,000. At 88 days on market, Yamhill County homes are sitting significantly longer than the Portland Metro average of 68 days. Sellers in Yamhill County in particular need to come in priced correctly, extended market time is harder to recover from in a slower fall environment.
POLK & MARION COUNTIES

Polk & Marion: September in Review
• Closed Sales: 196 ▲ 2.1% vs September 2025
• Pending Sales: 197 ▼ 13.2% vs September 2025
• New Listings: 244 ▼ 14.7% vs September 2025
• Average Sale Price: $457,200 ▼ 8.9% vs September 2025
• Median Sale Price: $451,500 ▼ 2.3% vs September 2025
• Inventory: 4.6 months ▼ 0.2 vs August 2026 • Total Market Time: 71 days ▲ 7 days vs September 2025
Note: RMLS serves as a supplementary MLS for Polk and Marion Counties, so these figures reflect meaningful but not complete market activity.
The year-over-year price drop in Polk and Marion, down 8.9% on average, needs honest framing. Part of it is a comparison effect: August 2026 was an unusually strong month that inflated the baseline. But part of it is also real. The median sale price is down 2.3% year-over-year, and that number does not have a flattering explanation. Buyers in this market are negotiating harder, and sellers are meeting them. That is what a transitioning market looks like.
Closings held up relatively well, 196, up 2.1% over last year, the third consecutive month of year-over-year closing gains. That is genuinely encouraging. But pending sales down 13.2% and new listings down 14.7% both point to a market that is tightening up heading into winter, fewer people entering the process on either side. That often leads to slower activity in November and December, which is typical, but worth factoring in if you are timing a move.
Closings are up, but prices are under pressure and pending sales are dropping. That combination, more closings on yesterday's contracts, fewer new buyers entering today, is the classic picture of a market transitioning from seller-favored to buyer-favored. The rolling data is still slightly positive, but the monthly signals point in a different direction. Both things are true.

Price bands leaned toward the $500K–$600K range at 31.3% of closings (87 sales), with $400K–$500K at 23.0% (64 sales) and $600K–$700K at 15.5% (43 sales). A concentration of higher-priced closings (5.8% in the $800K–$900K range) pulled the average price up even as the median fell which is why the median is the more reliable read on where this market actually is right now.
Market time reached 71 days, up from 63 in July and 62 in August. Three straight months of rising market time in Polk and Marion is a consistent trend, not a one-month blip. Homes are taking longer to sell. Sellers need to price for the market they are in, not the one from six months ago.

Finding Silver Linings into the end of 2026
Sellers, Here's Your Window: This is not a market to overprice and wait out. With 20.8% of listings nationally taking price cuts, the highest September rate since 2018, and local market time rising in both Portland Metro and Polk & Marion, the cost of coming in too high is real. Motivated buyers are out there, but they are doing their homework. A well-priced, well-presented home will move. An overpriced one will sit, and sitting homes lose leverage every week they are on market. Fall listings attract serious buyers who have been searching all year. Price correctly and you are not competing against a flood of new inventory. That is still a genuine advantage.
For Active Buyers: Inventory is the highest it has been all year, 4.2 months in Portland Metro, 4.6 in Polk & Marion. Nationally, inventory has climbed to 4.8 months, and 1 in 5 sellers just took a price cut. You have way more options and far more negotiating room than buyers have had in several years. That does not mean lowball offers will fly, well-priced homes are still moving, but it does mean you can negotiate on terms, ask for repairs, and take a breath before deciding. Use that leverage.
The Big Picture: Nationally and locally, this market has shifted. It is not a crash, prices are not collapsing, and transaction volume, while below peak, is not in free-fall. What has changed is leverage. Buyers have more of it than they did a year ago. Sellers have less. In a well-priced purchase-and-sale, there will be give and take on both sides. The market rewards realistic pricing, strong presentation, and good timing, and penalizes wishful thinking more than it used to.
Also, if you are buying and selling at the same time, we have some practical tips on timing your move around your home sale. Worth a read before you map out your Q4 timeline.
We're Ready When You Are
Whether you are still weighing options, ready to list before year-end, or actively searching, a conversation costs nothing and usually makes the path forward a lot clearer. We know these numbers, and more importantly, we know the neighborhoods behind them.

Amy McCormick, Principal Broker
503-310-7803 | amy@thebellacasagroup.com
Catherine Summers, Principal Broker
971-219-9858 | catherine@thebellacasagroup.com
Joni McCreith, Principal Broker
503-310-5613 | joni@thebellacasagroup.com
Molly Barajas, Principal Broker
503-310-4267 | molly@thebellacasagroup.com


Comments